Visualizing Uncertainty: The Whole-Life Crisis
- Type
- Master’s Project
- Role
- Designer
- Year
- 2025
About the project
Life crises are usually filed under named stages, like a quarter-life or mid-life crisis. But that never matched what I saw: people in their 20s, 40s, and 60s all describing the same "in-between" feeling. This project reframes uncertainty as something we navigate continuously, and as a shared experience across age and background.
My role
I led the project end to end, from research to prototype. The core challenge was turning messy qualitative data into something structured and comparable, so I built a multi-dimensional Life Graph mapping emotion, certainty, and crisis over time, then designed it into an interactive prototype for reflection and comparison.
Understanding how people experience life crises
This project began with a personal question: Why does life still feel uncertain in my 30s?
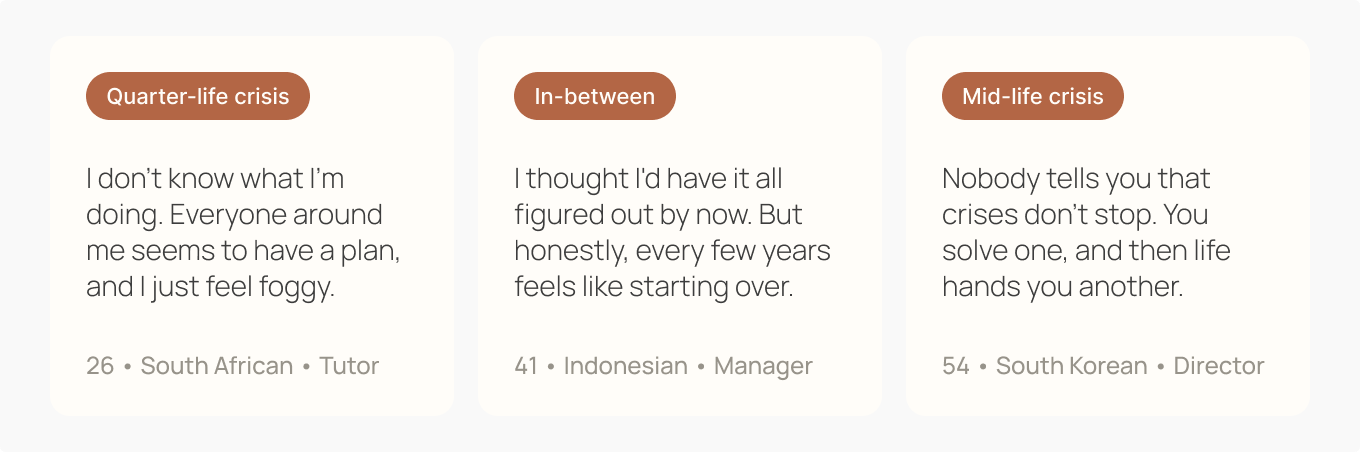
I explored existing concepts such as the quarter-life crisis and mid-life crisis, which describe specific life stages marked by uncertainty and reflection. However, I wanted to understand whether uncertainty is truly limited to these stages.
To investigate, I combined literature research on life transitions with semi-structured interviews, speaking with young adults (20s–30s) and older adults (40s–60s) across different cultural backgrounds.
From the interviews, I identified recurring themes
- People describe life as “in-between,” “uncertain,” and “not linear.”
- Major life changes often come unexpectedly.
- Uncertainty exists across all life stages, not just early adulthood.
Problem framing: the Whole-Life Crisis
Through research and interviews, I found that people across different ages described similar patterns of uncertainty, yet often believed their struggles were unique. This led me to reframe the problem as a Whole-Life Crisis.
Key findings
- Life is not defined by one or two crises, but a continuous process of navigating uncertainty.
- People often feel isolated, even though these experiences are universal.
Design decision: why a graph?
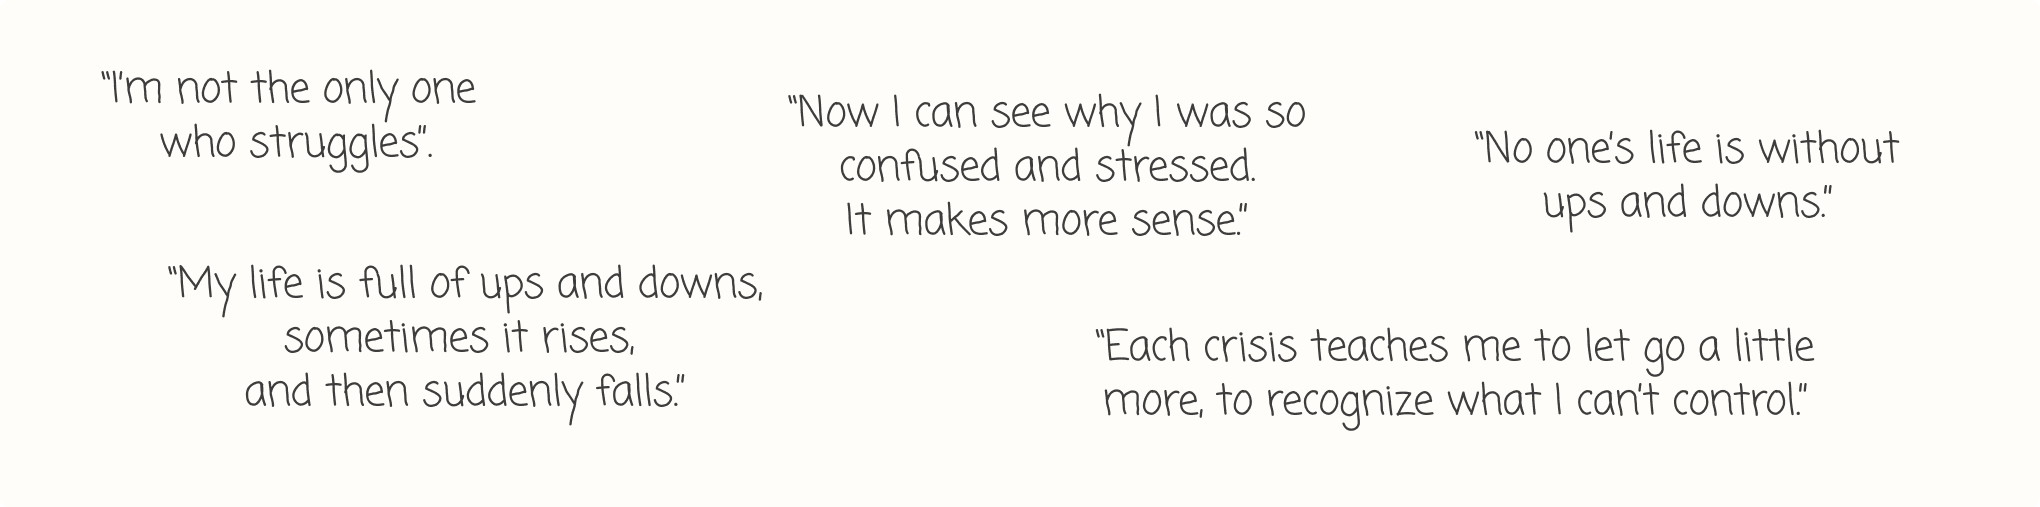
During interviews, participants naturally described their lives using phrases like “ups and downs,” “turning points,” and “highs and lows.” This revealed that people already perceive life as a trajectory over time.
Based on this observation, I explored ways to represent life experiences visually and chose a graph structure because it clearly communicates change, patterns, and turning points across time. A graph also enables comparison between different life journeys, making individual experiences more relatable.
However, representing life as a single line was not sufficient to capture its complexity. I needed a way to reflect both emotional and contextual depth within the same system.
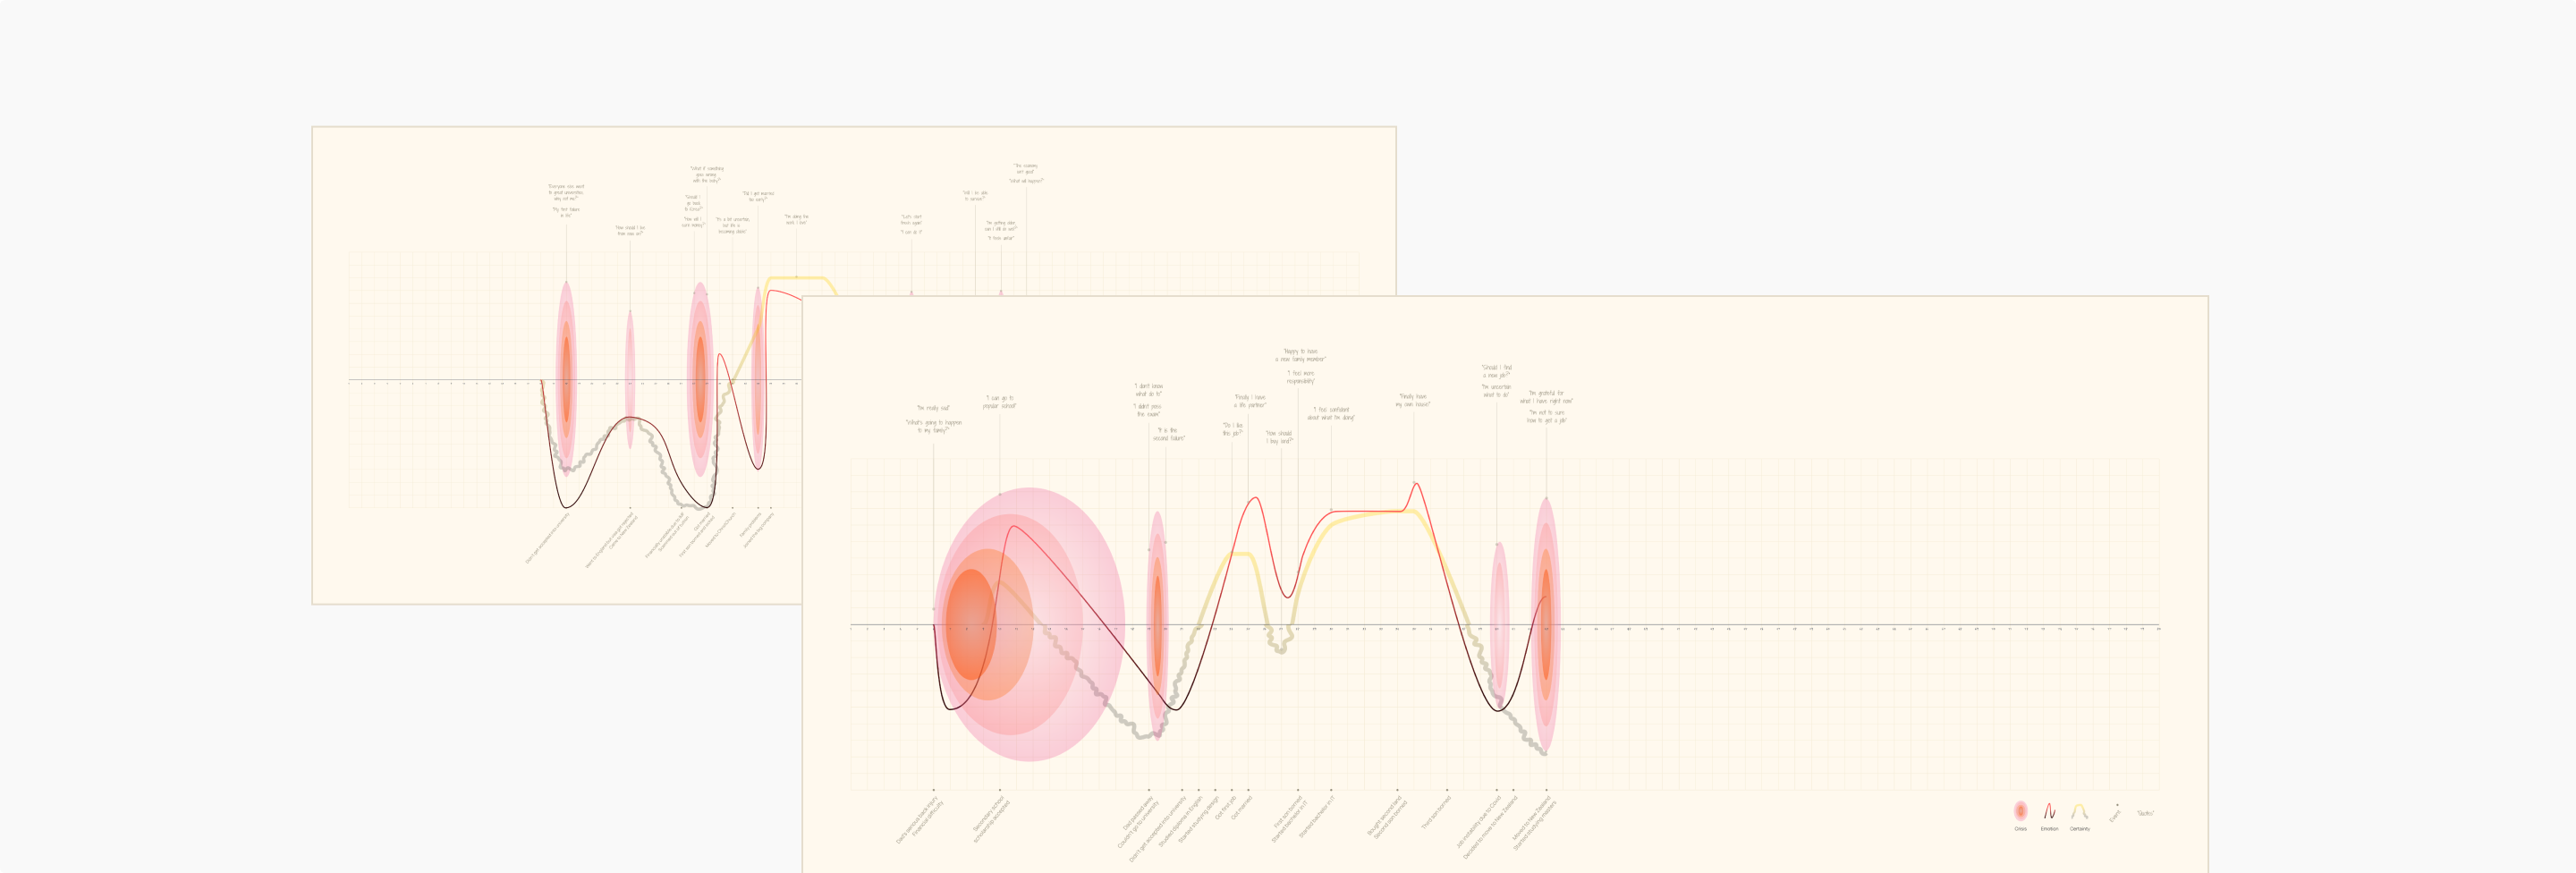
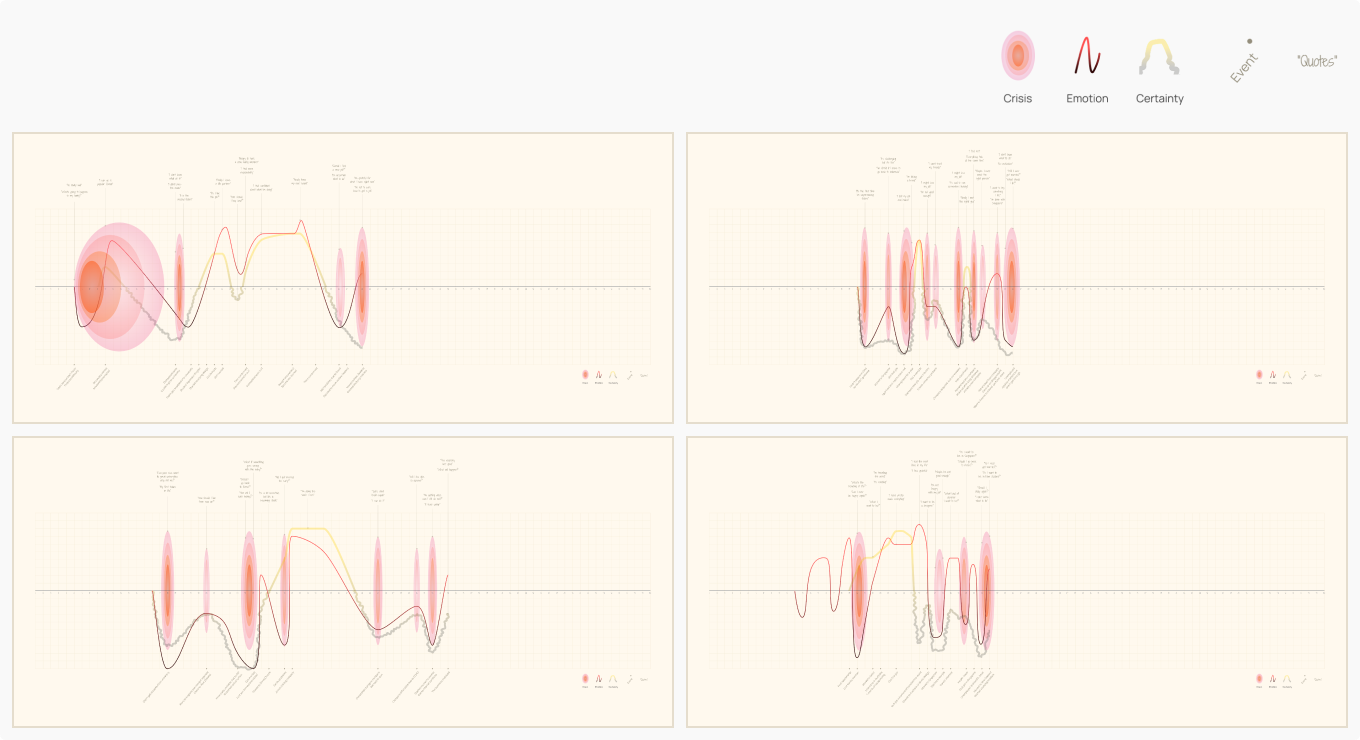
Creating the Life Graph
To capture this complexity, I developed a multi-dimensional Life Graph system using four key metrics:
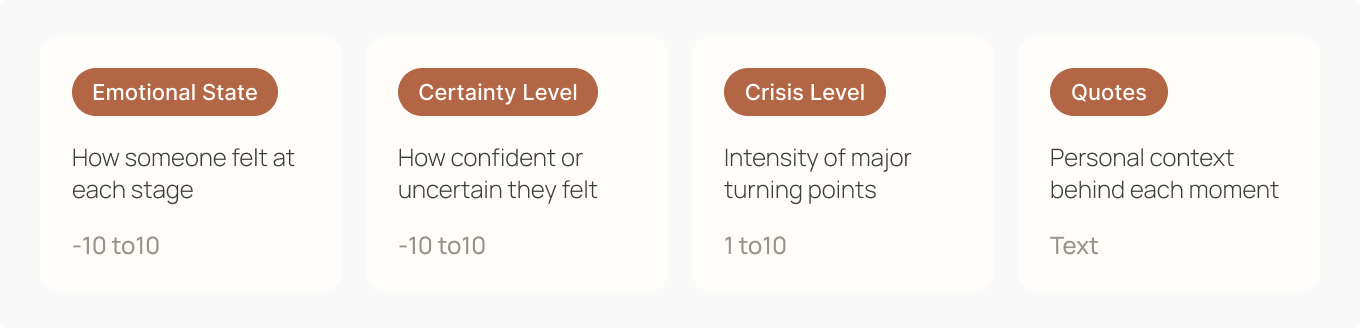
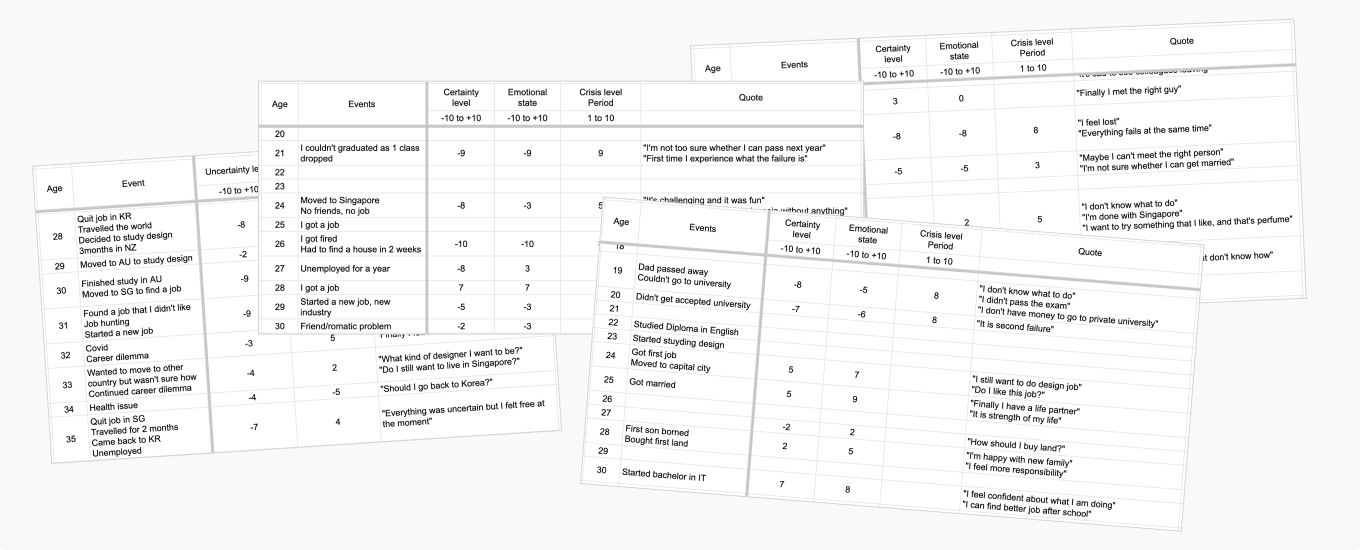
This combination allowed the graph to represent both patterns over time and individual narratives, balancing analytical clarity with emotional meaning. To test whether this system could meaningfully represent real experiences, I applied it to three interview participants and my own life journey — resulting in four life graphs that let me compare different paths and evaluate whether the structure could capture diverse experiences.
User feedback: from visualization to insight
After creating the graphs, I revisited participants and asked them to reflect on their own graphs and others’. Many said that visualizing their lives helped them understand past emotions and decisions and brought clarity to once-confusing periods. Comparing with others also revealed that uncertainty and crisis are universal. What started as a visualization exercise became a reflective experience.
Product experience: reflecting and exploring life journeys
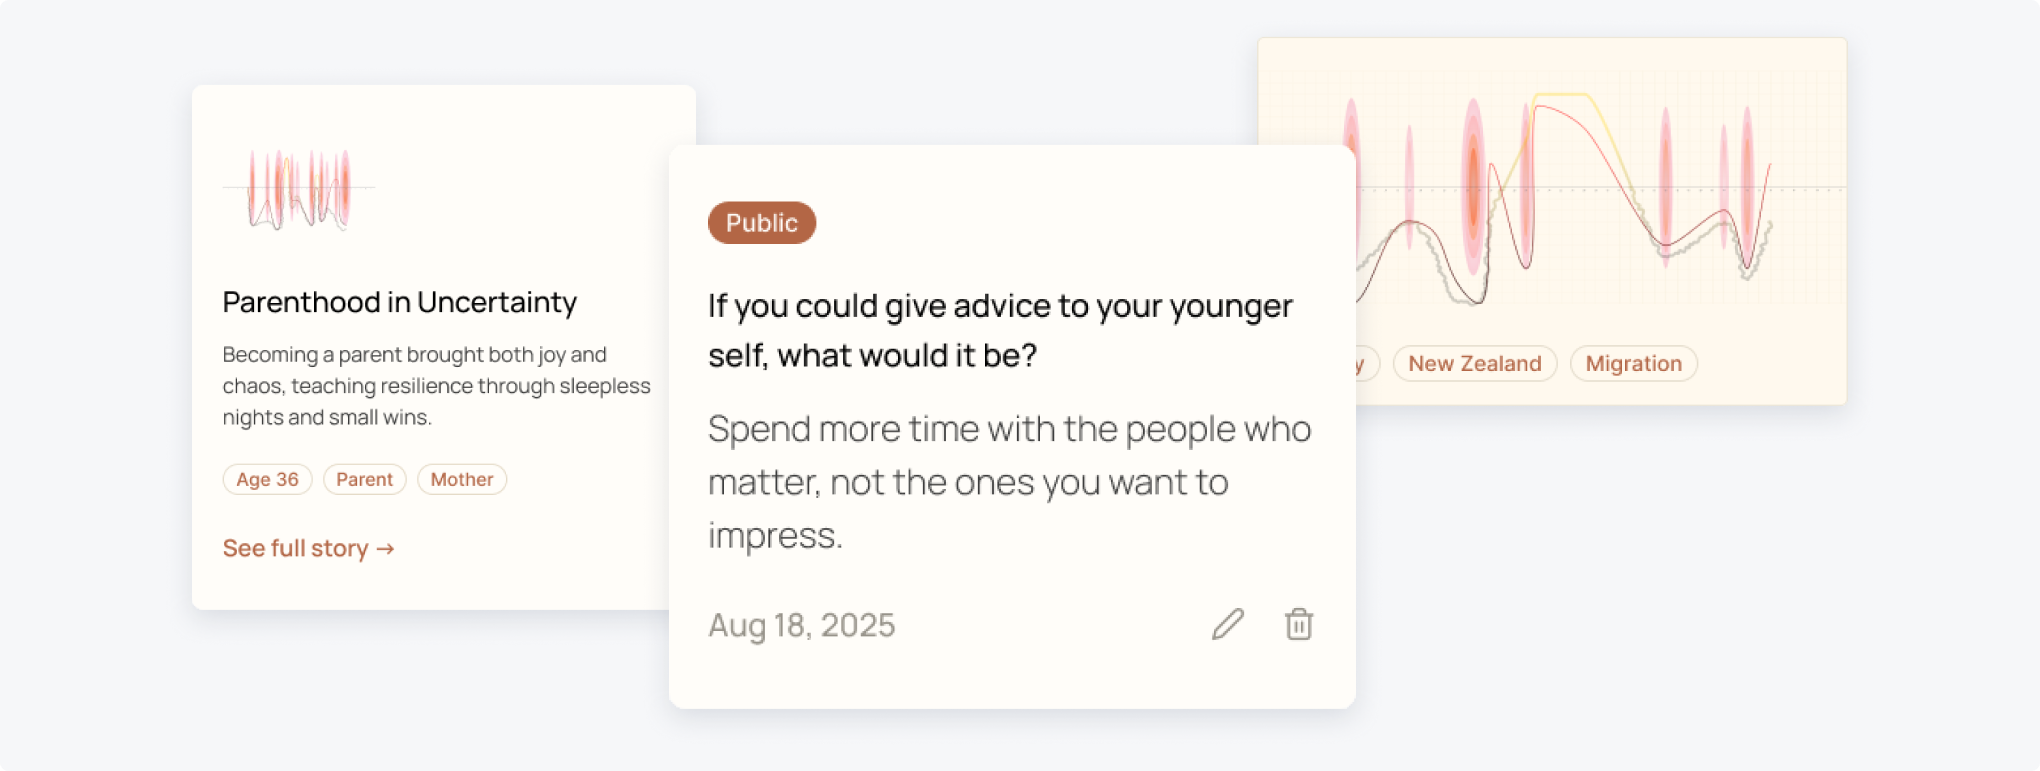
Based on these insights, I expanded the Life Graph from a visualization tool into a product experience focused on reflection and connection.
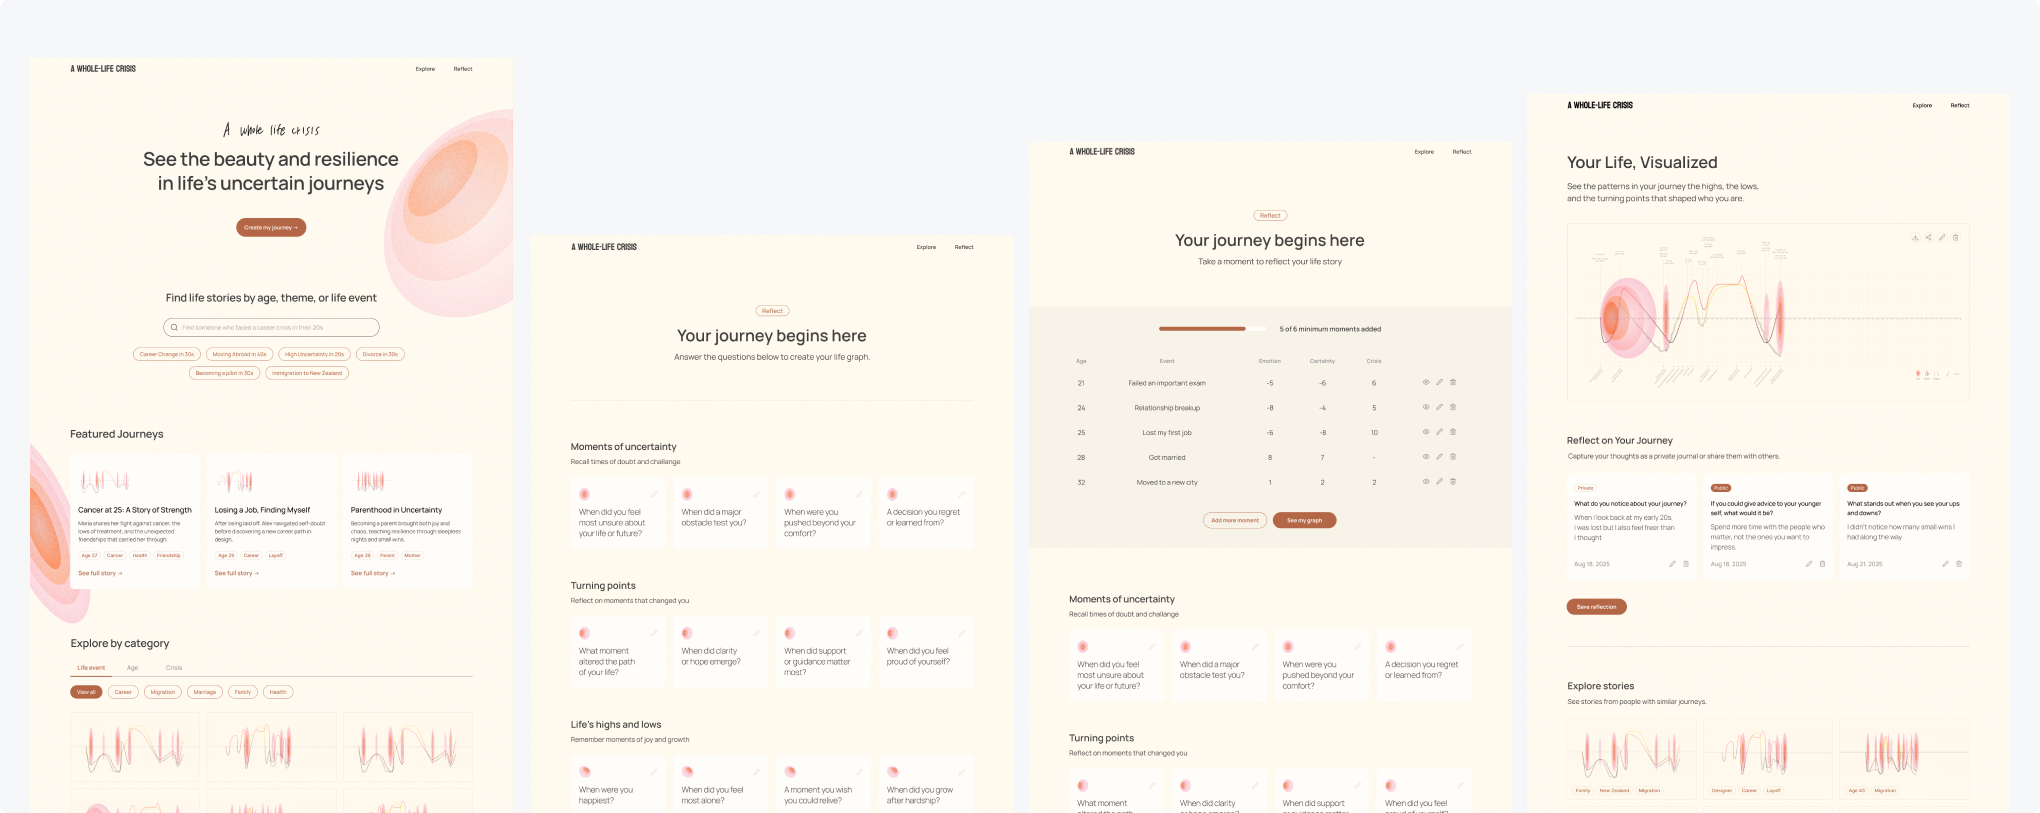
The platform is designed around two core flows:
Reflect
Users answer guided prompts about life events, uncertainty, and turning points. Their responses are structured and visualized as a Life Graph, enabling personal reflection.
Explore
Users browse other people’s life graphs by age, theme, or life event. By comparing journeys, users recognize shared patterns of uncertainty and feel less isolated.
By combining self-reflection and comparison, the experience transforms individual crises into a shared understanding — helping users see that their journey is not unique, but part of a broader human experience.
Reflection
What began as a question about my own life grew into a system that helped others see theirs more clearly. Beyond strengthening how I turn qualitative research into design frameworks, this project showed me that design can give shape to something as abstract as uncertainty, and help people feel less alone in it.